


How to Automatically Generate Bubble Charts for 2D Drawings: Learn Custom Bubble Chart Numbering Techniques with You
Release time:
2025-05-26 12:04
Source:
The Charm of Bubble Charts
In the fields of engineering design and data visualization, bubble charts are favored by many designers for their intuitive presentation. They not only effectively convey complex information but also display relationships between data through bubbles of different sizes and colors. However, how can these bubble charts be integrated with design drawings to automatically generate bubble chart numbering? Next, let's discuss this topic.
The Importance and Steps of Customizing Bubble Chart Numbering
In the industrial manufacturing field, automatically generating bubble charts and customizing numbering for 2D drawings is crucial for digital quality management.
Supporting Digital Quality Processes
The QIF standard of the IOS standard manages features and characteristics, converting annotations in engineering drawings (such as dimensions and tolerances) into digital information. Bubble charts, as characteristic identifiers (such as "bubble numbering"), are the core carriers connecting design, manufacturing, and quality inspection.
Reducing Redundancy and Human Errors
In traditional processes, bubble numbering needs to be manually annotated and linked with characteristics (such as FAI forms and control plans), which easily leads to data inconsistencies (pages 6-7). Automatic generation can eliminate transcription errors and improve efficiency.
Paving the Way for MBD Transition
Digitizing PMI information from 2D drawings, that is, automatically generating machine-readable bubble charts, is a bridge for enterprises to move towards full semantic MBD. By implementing digital characteristic management through BALLOON2D, enterprises can build enterprise-level characteristic strategies in advance and seamlessly connect to future MBD environments.
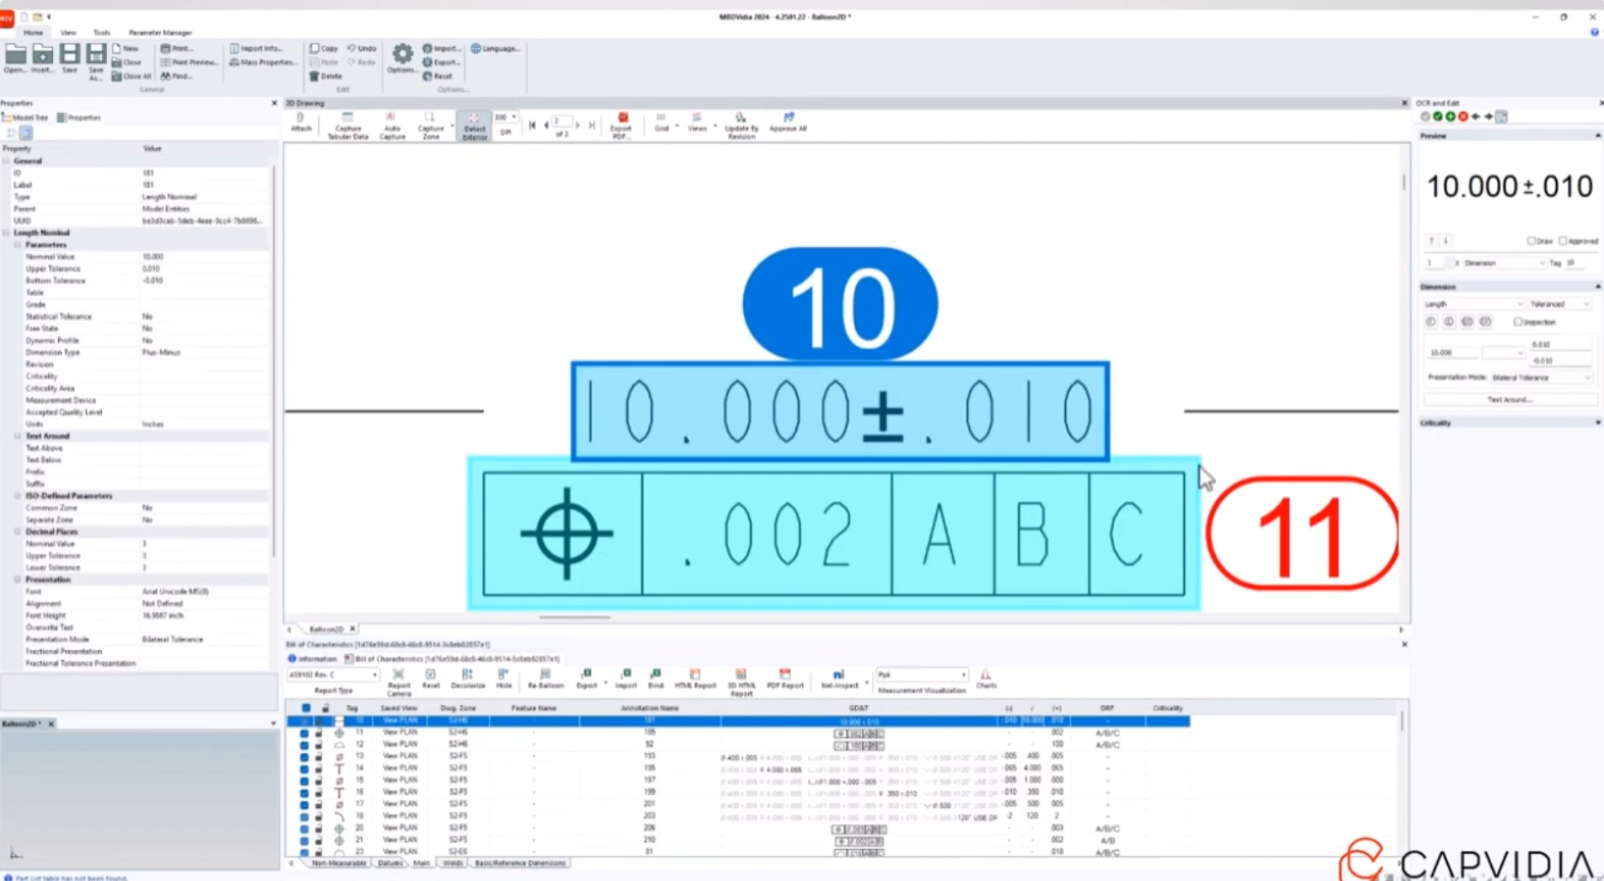
Next, let's take the example of using BALLOON2D to automatically generate bubble charts and understand the basic steps involved:
1. Drawing Preprocessing: Ensure that the 2D drawings meet standards (currently BALLOON2D supports PDF format well), and annotations are complete (dimensions, tolerances, surface roughness, etc.). QIF features need to be associated with drawing geometry (such as cylinders, planes), and BALLOON2D must be able to recognize these features.
2. Feature and Characteristic Extraction: Use BALLOON2D's automation to scan drawings, identify geometric features (such as holes, slots) and corresponding characteristics (such as diameter tolerance, positional tolerance).
3. Customizing Bubble Numbering Rules: In BALLOON2D software, numbering rules can be configured, such as setting prefixes/suffixes, defining "F-" to represent features, "C-" to represent characteristics; setting increment logic, assigning sequence numbers by drawing area (Sheet Zone) or feature type. The "QIF Characteristic Architecture" requires bubble numbering to be associated with drawing ID, area, and other information to ensure traceability.
4. Automatically Generating Bubble Charts: Run BALLOON2D, the software will automatically annotate bubble numbers based on features and characteristics and generate a characteristic list (BOC). Capvidia tools can bind bubble charts with QIF data for direct use in quality plans (such as FAI, SPC).
5. Using the bubble charts automatically generated by BALLOON2D, you can export to PDF, HTML, Excel, Net-Inspect.

Summary
Through the above steps, you can easily automatically generate bubble charts for 2D drawings and customize bubble chart numbering. After mastering these skills, design work will become more efficient and communication smoother. Give it a try!
Custom Bubble Chart Number